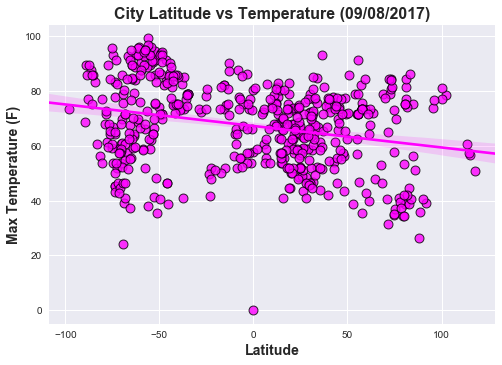
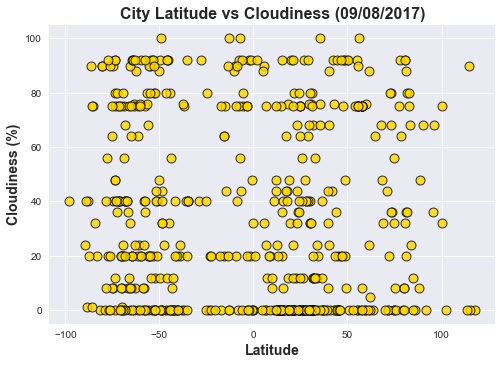
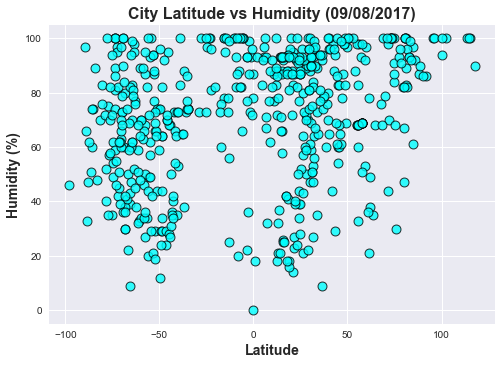
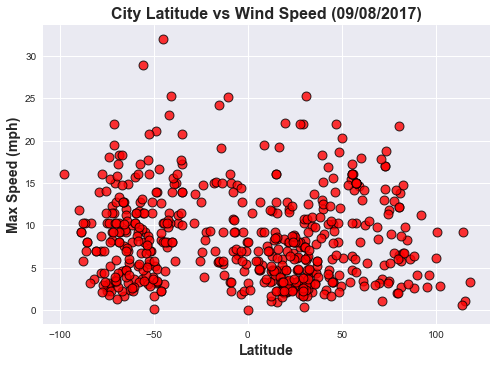
Summary: Latitude vs. X
This is a study of weather in cities around the globe, the gathering
of data, creation of charts, and analysis of the results. Geography
and remembering geography lessons from too many years ago played a
large part in the proper gathering of the data. To get a reasonable
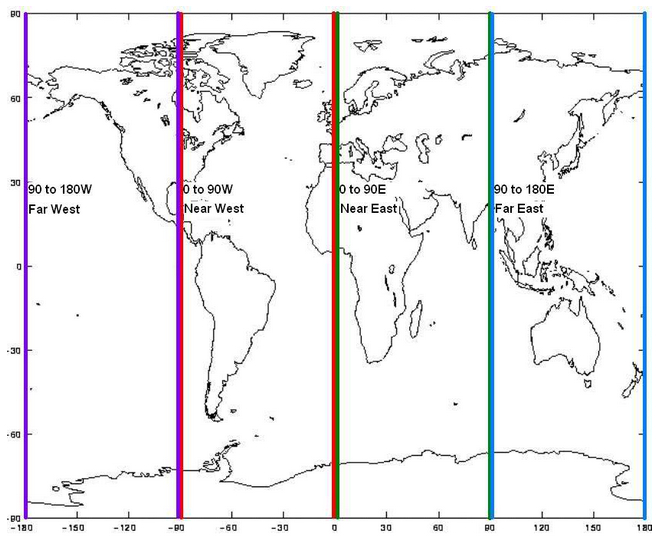
distribution of data points, I choose a method of dividing the
earth into quadrants using the image on the right. From the image,
I used the x-axis as latitude -180.0 to 180.0(Far West to Far East),
and the y-axis was -90.0 to 90.0.
Latitude and longitude are imaginary (unreal) lines drawn on maps
to easily locate places on the Earth. Latitude is distance north
or south of the equator (an imaginary circle around the Earth
halfway between the North Pole and the South Pole) and longitude
is distance east or west of the prime meridian (an imaginary line
running from north to south through Greenwich, England). Both are
measured in terms of the 360 degrees (symbolized by °) of a circle.
Lines of latitude start at 0 degrees at the equator and end a 90
degrees at the North and South Poles. Everything north of the
equator is known as the Northern Hemisphere and everything south
of the equator is known as the Southern Hemisphere. Lines of
latitude are called parallels and in total there are 180 degrees
of latitude.
Longitude is the measurement east or west of the prime meridian.
Longitude is measured by imaginary lines that run around the Earth
vertically (up and down) and meet at the North and South Poles.
These lines are known as meridians.
Overall, the point of the exercise was to understand the data (in
geo-coordinate terms), to understand what questions we were are trying
to answer, and how to best present that data to tell the story.
Visualizations